Object detection is one of the most common use cases for computer vision. There are many methods of dealing with this problem, but increasingly often, neural networks are used. To achieve high performance, deep neural networks require a large training data sets. This article will describe how to deal with an extremely small amount of data in the logo detection problem. This issue will be mitigated by generating a synthetic dataset, which will be similar to the initial dataset in key aspects.
Object detection
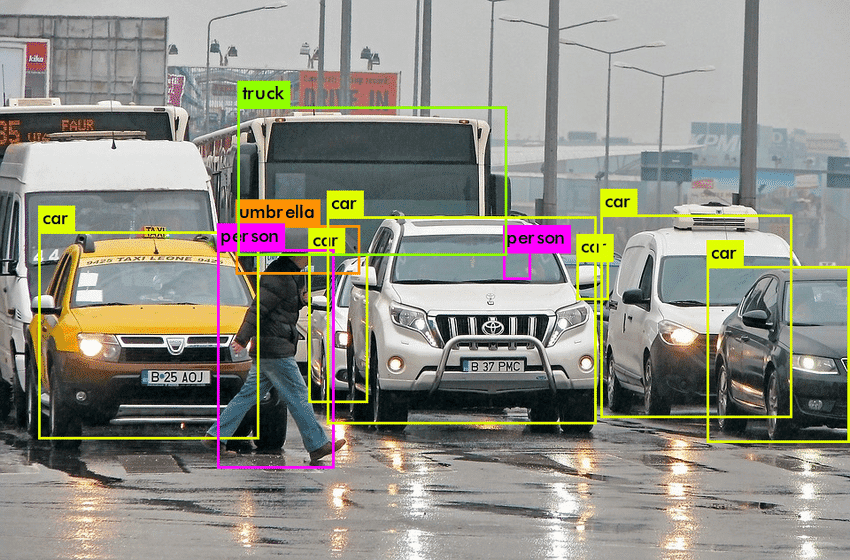
Object detection is a family of problems in the field of computer vision centered around finding objects in images or videos. In object detection with Convolutional Neural Networks (CNN), the input data typically consists of images or video frames, and the output data consists of bounding boxes and class labels that identify the objects within the images.
More and more tasks require object detection (such as humans, buildings, or cars), which has many uses. This is why it is such a dynamically developing part of computer vision. With the advancement of deep learning, object detection has seen significant improvements in terms of speed and accuracy. This article will discuss the challenges of detecting overlay and organic objects, the task of logo detection, and the metrics used to evaluate object detection models.
Challenges of Logo Detection
Logo detection is a specific task in object detection that involves detecting brand logos in images and videos. Often the task is to distinguish logos that differ in small details, e.g. a different inscription under the logo. Logos can also be partially or fully covered by other objects, making them difficult to detect. Logos can appear in a wide range of images and videos, such as advertisements, billboards, and product packaging, and can be in different orientations and lighting conditions.
Business case
Logo detection on advertisement assets offers businesses the ability to monitor and protect their brand, analyze ad campaign performance, gain competitive insights, detect copyright infringement, analyze consumer behavior, and ensure compliance with branding guidelines. These benefits contribute to effective brand management, improved marketing strategies, and enhanced overall advertising effectiveness.
Organic and overlay objects
A set of detected objects may encompass a diverse range of categories, including animals, people, and food. These objects can either exist within a natural setting, such as a photographic image, or they can be synthetically generated as part of the creation of a digital asset. However, in the context of logo detection, the assets encountered often feature overlay logos. It's crucial to distinguish between two primary categories of logos: organic and overlay.
 An organic logo is one that naturally appears within an image or scene, typically as an integral part of the visual composition. On the other hand, an overlay logo is one that is superimposed over an image, often after its initial creation, using computer graphics or editing software. The distinction between these logo types holds significant importance, particularly in specific tasks like logo detection. In such cases, the primary objective is usually to identify and locate computer-imposed logos, i.e., overlay logos, as they can have various implications for copyright, branding, and content analysis. Therefore, understanding whether a logo is organic or overlay becomes a critical factor in effectively addressing logo detection challenges.
Methods Used to Detect Logos
There are several methods used to detect logos, such as template matching, feature-based methods, and convolutional neural networks (CNNs). Template matching is a simple method that involves comparing a logo template to different regions in an image. Feature-based methods involve extracting features from an image, such as colour or texture, and matching them to a logo template. CNNs are a powerful method for logo detection because they can learn to recognize logos from a large dataset of images. The advantage of this solution is the lack of custom algorithms for each type of logo.
Dataset
Importance of datasets in object detection tests
It is essential to remember that the quality of a model is dependent on the quality of the data. When the data is inadequate in diversity or quality, the ML algorithms may suffer from overfitting, which occurs when the model learns from irrelevant or extraneous details and noise in the low-quality data, resulting in a poor performance of the model.
The problem of insufficient training data
When you have limited data for training a model, it can be challenging to achieve good performance. However, there are several techniques that can be used to make the most of the data you have and improve the model's performance. Here are a few methods you can try:
Data augmentation: Data augmentation is a technique that artificially increases the size of your dataset by applying random transformations to the existing images. Common data augmentation techniques include rotation, flipping, cropping, and scaling. These techniques can help to reduce overfitting and improve the model's ability to generalize to new images. However, it must be chosen carefully, because certain types of data augmentation, such as cropping or resizing, can result in information loss.
Transfer learning: Transfer learning is a technique that involves using a pre-trained model as the starting point for training a new model. The pre-trained model is typically trained on a large dataset and can be used to extract features from images. The extracted features can then be used to train a new model on your limited dataset, allowing you to leverage the knowledge learned from the pre-trained model. However, If there is a significant difference between the source and target domains, transfer learning may suffer from a domain mismatch.
Semi-supervised learning: Semi-supervised learning is a technique that uses a combination of labelled and unlabelled data to train a model. In the case of object detection, it can be used to train a model on a limited dataset by using already trained models to predict labels on the unlabelled data, and then use the predicted labels to fine-tune the model. While this approach can leverage a larger amount of data compared to fully supervised learning, the unlabeled data lacks explicit annotations for object detection
Synthetic data generation: Synthetic data generation is a technique that creates artificial images to supplement the real images in the dataset. This can be achieved through automated asset creation or by applying transformations to existing images. This method can be useful when there is a lack of real images available for a specific object class. Synthetic data is typically generated based on predefined rules or models, which can result in a limited range of object appearances, shapes, textures, and backgrounds. This lack of diversity may hinder the model's ability to generalize to real-world scenarios.
In the logo detection task, the approach with generating a synthetic dataset is a good choice, because logos always appear in the overlay type. This means that it is simple to generate such data, because it is enough to put a logo on the asset. In most object detection tasks, data generation is a difficult task, because objects may have complex structure (objects are represented in 3D, and appear at different angles, and often each sample has a different appearance)
The theory itself is simple: download the backgrounds and paste logos on them. Let's generate a very large amount of assets by creating a dataset in the Common Objects in Context (COCO) format. Then let's train the model. And let's see how it behaves on real data.
In machine learning, it is very important to pay great attention to data analysis, therefore, in the conducted experiments, great emphasis will be placed on data analysis.
Basic approach
This section will describe the basic approach to logo detection. Quickly visually analyse client data, generate data, train a default model, and analyse the results. It will take into account the most common errors in this approach and try to solve them.
The aim is to detect the Wunderman Thompson Commerce & Technology logo.
Download 1000 random images, paste augmented logos on them, then generate a coco json file. Create 10,000 training photos for the model.
Train detectron2 object detection model on generated dataset. Inference model on client data. The results are shown below:
Results analysis
As can be seen, the approach without any analysis brought poor results, listed below:
- model did not recognize small logos
- marked text as a logo
- and marked the logo of another organization.
Let's try to fix these errors! But first there is need to have evaluation metrics on the client dataset.
Data labelling
Before starting the analysis, you first need to obtain reference point. You received 200 sample assets from the client, so you should label them first. Thanks to this, you will be able to analyze the properties of the dataset and calculate model performance metrics. In case you have a small amount of data, you can do it manually. There are many tools for labelling the dataset and exporting it to the COCO format, e.g. Labelbox, RectLabel, and VGG Image Annotator (VIA). You will use Azure Machine Learning Studio for this. An example of a labelling operation is shown below:
Model evaluation
When working with a small amount of data, which is additionally unbalanced. It should take into account several factors:
- When calculating the metrics related to the detection, not only assets, on which logo was detected, should be taken into account, but also assets, on which the logo was not detected, and it is there.
- Do not use the default COCO evaluator. It computes the metrics assuming that the class distribution is equal. In our case, the distribution of classes is very unbalanced (because the client does not have the relevant data). In this case you have to use a custom evaluator, that takes into account the weighted average AP per class
Average Precision (AP) is a widely used metric to assess the performance of object detection models. It is calculated as the average value of the precision-recall curve obtained at different Intersection over Union (IoU) thresholds. Precision represents the ratio of correct positive detections to all positive detections made by the model, while recall represents the ratio of correct positive detections to all actual objects present in the image. The IoU threshold is used to determine whether a predicted bounding box and a ground-truth bounding box match. If the IoU between a predicted bounding box and a ground-truth bounding box exceeds the threshold, the predicted bounding box is considered a true positive.
| Metric | Intersection over Union | Area of object | Number of detections | Value |
|---|---|---|---|---|
| Average Precision (AP) | IoU=0.50:0.95 | area=all | maxDets=100 | 0.821 |
| Average Precision (AP) | IoU=0.50 | area=all | maxDets=100 | 0.889 |
| Average Precision (AP) | IoU=0.75 | area=all | maxDets=100 | 0.871 |
| Average Precision (AP) | IoU=0.50:0.95 | area=small | maxDets=100 | 0.342 |
| Average Precision (AP) | IoU=0.50:0.95 | area=medium | maxDets=100 | 0.582 |
| Average Precision (AP) | IoU=0.50:0.95 | area=large | maxDets=100 | 0.965 |
| Average Recall (AR) | IoU=0.50:0.95 | area=all | maxDets=1 | 0.839 |
| Average Recall (AR) | IoU=0.50:0.95 | area=all | maxDets=10 | 0.852 |
| Average Recall (AR) | IoU=0.50:0.95 | area=all | maxDets=100 | 0.852 |
| Average Recall (AR) | IoU=0.50:0.95 | area=small | maxDets=1 | 0.351 |
| Average Recall (AR) | IoU=0.50:0.95 | area=medium | maxDets=1 | 0.778 |
| Average Recall (AR) | IoU=0.50:0.95 | area=large | maxDets=1 | 0.968 |
The AP metric table generated by the COCO evaluator typically includes the following columns:
- IoU threshold: the Intersection over Union threshold used to determine a match between a predicted bounding box and a ground truth bounding box.
- AP: the average precision, which is the average of the precision-recall curve over the specified IoU threshold.
- AP (small): the AP for objects with an area of less than 32 pixels squared.
- AP (medium): the AP for objects with an area between 32 pixels squared and 96 pixels squared.
- AP (large): the AP for objects with an area greater than 96 pixels squared.
- AR: average recall, which is the average recall for different IoU thresholds
- maxDets: the number of detections taken to calculate the metric
Troubleshooting
Small logos are not detected
Looking again at the prediction results of our baseline model, you can see that not all logos were detected, especially the small size logos. The first thing you need to pay attention to is the AP metrics for each size. As you can see in the picture above, there is 0.96 AP for large objects, 0.58 AP for medium ones, and 0.34 AP for small ones, which confirms the assumption that the model fails to detect small logos. This is due to the fact that in the generated training set, the applied logos had sizes that did not correspond to the actual sizes. The next steps will be the analysis of the client dataset, which will be called EDA.
Exploratory Data Analysis (EDA)
EDA is an approach to analysing and understanding data sets by identifying patterns, trends, and relationships within the data. The goal of EDA is to uncover insights and generate hypotheses about the data, rather than to confirm preconceived notions or hypotheses. One of the first steps in EDA is to get a sense of the overall structure of the data. This can be done by examining summary statistics such as mean, median, and standard deviation, as well as visualizing the data using plots such as histograms and scatter plots. These visualizations can help to identify outliers, skewness, and other patterns in the data.
After label the entire client dataset, export the result to a json file that describes our dataset in the COCO format. This file contains all the information needed to analyse asset dimensions, logo dimensions and other properties. In order to be able to generate an appropriate set of synthetic data, take into account two most important things:
- Dimensions of the generated logo (the dimensions should correspond to the dimensions of the logo in the client data)
- Dimensions of generated assets (the dimensions should correspond to the dimensions of the assets in the client data)
These are the most important attributes whose good adjustment will translate into good performance of the model. After that, the most important things are:
- Number of generated assets (the size of the synthetic dataset must not be too small)
- Themes of backgrounds (the backgrounds should be similar to the client dataset)
- Additional objects (if other objects appear regularly in the client dataset, they should be added to the background)
- Number of different backgrounds (backgrounds should be varied)
- Logo augmentations used (logo augmentation should be properly selected)
- Number of logos per asset (we should choose the number of generated logos on the asset in relation to the client's assets)
Data analysis results
Basic Dimensional Analysis:
| Minimal value | Maximum value | Average value | Standard deviation | |
|---|---|---|---|---|
| Assets width | 172.0 | 900.0 | 747.96 | 110.14 |
| Assets height | 97.0 | 3839.0 | 679.61 | 406.64 |
| Assets area | 42656.0 | 3048166.0 | 1.53 | 1.17 |
| Assets ratios | 0.21 | 9.28 | 1.53 | 1.17 |
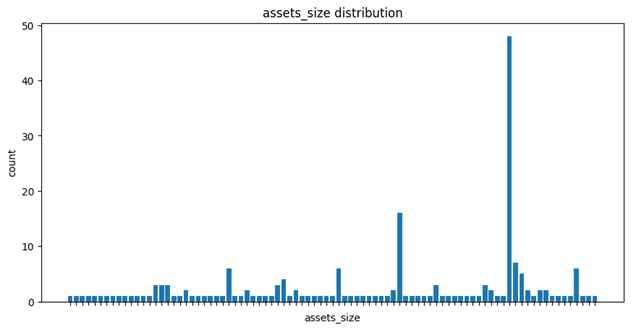
Distribution of dimensions with a table of the most common ones:
| Assets size | Number of usages |
|---|---|
| 794x794 | 48 |
| 794x447 | 16 |
| 794x993 | 7 |
| 720x1520 | 6 |
Assets width distribution:
 values between the first and third quartiles:
 Q1 - Q3: 794 - 794
Assets height distribution:
 values between the first and third quartiles:
 Q1 - Q3: 423 – 794
After analyzing, you can see that the client most often uses assets with dimensions of 794x794 and 794x447.
Next, let's analyze the dimensions of the logo in the customer data
The results below show the analysis of the square logo, not rectangle with text next to it.
Distribution of logos widths:
 values between the first and third quartiles:
 Q1 - Q3: 44 – 91
Distribution of logos heights:
 values between the first and third quartiles:
 Q1 - Q3: 44 – 92
You can see that the client uses a very small size of the logo, noticing this is crucial.
Generating logos that are not in the majority of the range (44-92) width/height pixels will mean that the model will not be able to learn the features of these logos that occur in these sizes.
Training the model on very high-resolution logos paradoxically does not mean that the model will recognize low-resolution or small-sized logos.
Small logos are not detected - Conclusions
During the next generation of the dataset, you should paste logos with dimensions from the appropriate range, which are characteristic of logos on real assets.
Detection of text as a logo
In the graphs presenting the results of the model, it can be seen that often the model marks the text as a logo, this is common false positive. But why is this happening? Let's look at the logo that the model was learning to detect:
You will notice that the logo also contains text. Often the logos of organizations or companies have an additional tag line or slogan, or even the entire logo is text. In this case, when generating a synthetic dataset, you should not only impose the logos which you are looking for, but also additional elements that will allow the model to learn that it is not to look for them. In this case it will be text, as in the example below:
Detection of other logos
As you can see from the prediction results, model also detect other objects as logos, especially objects that:
- have similar dimensions as the logo you are looking for
- have a similar shape to the logo you are looking for
- they often appear on assets in the client dataset
This challenge can be also solved by applying these elements to the asset when generating a synthetic dataset, as in the example below:
Training
Training the neural network model for object detection did not differ from the basic approach in the case of insufficient data. However, the process and the tools used for this are described below. To train model, Detectron2 was used which is an open-source object detection and image segmentation library developed by Facebook AI Research (FAIR). It is built on top of the PyTorch deep learning framework and is designed to be highly modular and extensible. It is a second version of detectron2, which was the first open-source object detection platform.
You can use predefined model faster_rcnn_R_101_FPN_3x from detectron2
zoo models. The default trainer was used in
these experiments. In addition, custom hooks with the following functions have been implemented:
- Sending metrics to Azure ML studio with MLflow
- Save the best model by monitoring the selected metric
- Early stopping
Framework used:
- Data analysis: custom script uses matplotlib, opencv, fiftyone, seaborn
- Data generation custom generator uses albumentations, opencv, scikit-image, Pillow with multiprocessing generation
- Model training: framework detectron2 trained on Azure Machine Learning clusters
- Model evaluation: custom scripts uses podm, numpy, pandas, matplotlib
Results of the experiments
The use of accurate data analysis during dataset generation significantly increased the performance of the model. You can see an improvement in both AP and AR for small, medium and large logos. The results of the evaluation on the test set are presented below:
| Metric | Intersection over Union | Area of object | Number of detections | Value |
|---|---|---|---|---|
| Average Precision (AP) | IoU=0.50:0.95 | area=all | maxDets=100 | 0.963 |
| Average Precision (AP) | IoU=0.50 | area=all | maxDets=100 | 0.995 |
| Average Precision (AP) | IoU=0.75 | area=all | maxDets=100 | 0.994 |
| Average Precision (AP) | IoU=0.50:0.95 | area=small | maxDets=100 | 0.956 |
| Average Precision (AP) | IoU=0.50:0.95 | area=medium | maxDets=100 | 0.962 |
| Average Precision (AP) | IoU=0.50:0.95 | area=large | maxDets=100 | 0.995 |
| Average Recall (AR) | IoU=0.50:0.95 | area=all | maxDets=1 | 0.979 |
| Average Recall (AR) | IoU=0.50:0.95 | area=all | maxDets=10 | 0.979 |
| Average Recall (AR) | IoU=0.50:0.95 | area=all | maxDets=100 | 0.979 |
| Average Recall (AR) | IoU=0.50:0.95 | area=small | maxDets=1 | 0.957 |
| Average Recall (AR) | IoU=0.50:0.95 | area=medium | maxDets=1 | 0.979 |
| Average Recall (AR) | IoU=0.50:0.95 | area=large | maxDets=1 | 0.999 |
Summary
The task of detecting objects is a very demanding task when you have limited amount of data. There are many ways to deal with this situation. Inadequate preparation for this task may result in poor model performance. This article lists good practices for generating a dataset in the absence of data. You can read about basic analysis of the model inference. There are presented the most common errors such as false positives and false negatives with the solutions which can help you to avoid those problems. In addition, basic data analysis is presented here, to help you explore the properties of your dataset. The work presented in the article offers valuable insights and practical strategies that can contribute to more effective object detection, addressing the challenges posed by limited data and improving the overall quality of the detection process.
