Automated video analysis is especially interesting from the perspective of modern branding, advertising, and bias-free communication. Microsoft Video Indexer can identify and tag some popular physical objects. We propose a mechanism to ensure a deeper view, to also recognise more abstract concepts and ideas, which are more intuitive but less easy to define.
Problem to solve
Automated video analysis is one of many applications of Artificial Intelligence. There are various tools, including Microsoft Video Indexer, that help users to associate predefined tags (like “person”, “hair”, “boat”, “plant”, etc.) with timespan in an uploaded video. As a result, one can quickly find a particular element in a video without any manual effort. The Video Indexer contains around a hundred tags that could be automatically assigned. And we cannot really expect to have much more. Why? Simply choosing a set containing popular, context-independent and easy-to-distinguish tags helps to ensure both a wider range of applications and higher indexing precision. On the other hand, the challenge is that we would like to identify more general concepts like, for example, adult content (which may be represented by various elements, like nudity, guns, cigarettes, violence, etc.), holidays (van, lake, beach, umbrella, etc.) or advert video ending (that could be a specific combination of various elements like text, logo, slogan, animation, etc.). None of the above could be easily and quantitatively defined in software, although intuitively we would identify them immediately as we see them. For the purpose of this blog, we will call them conceptual patterns and we will show you our solution to find an ending in a video.
MS Video Indexer
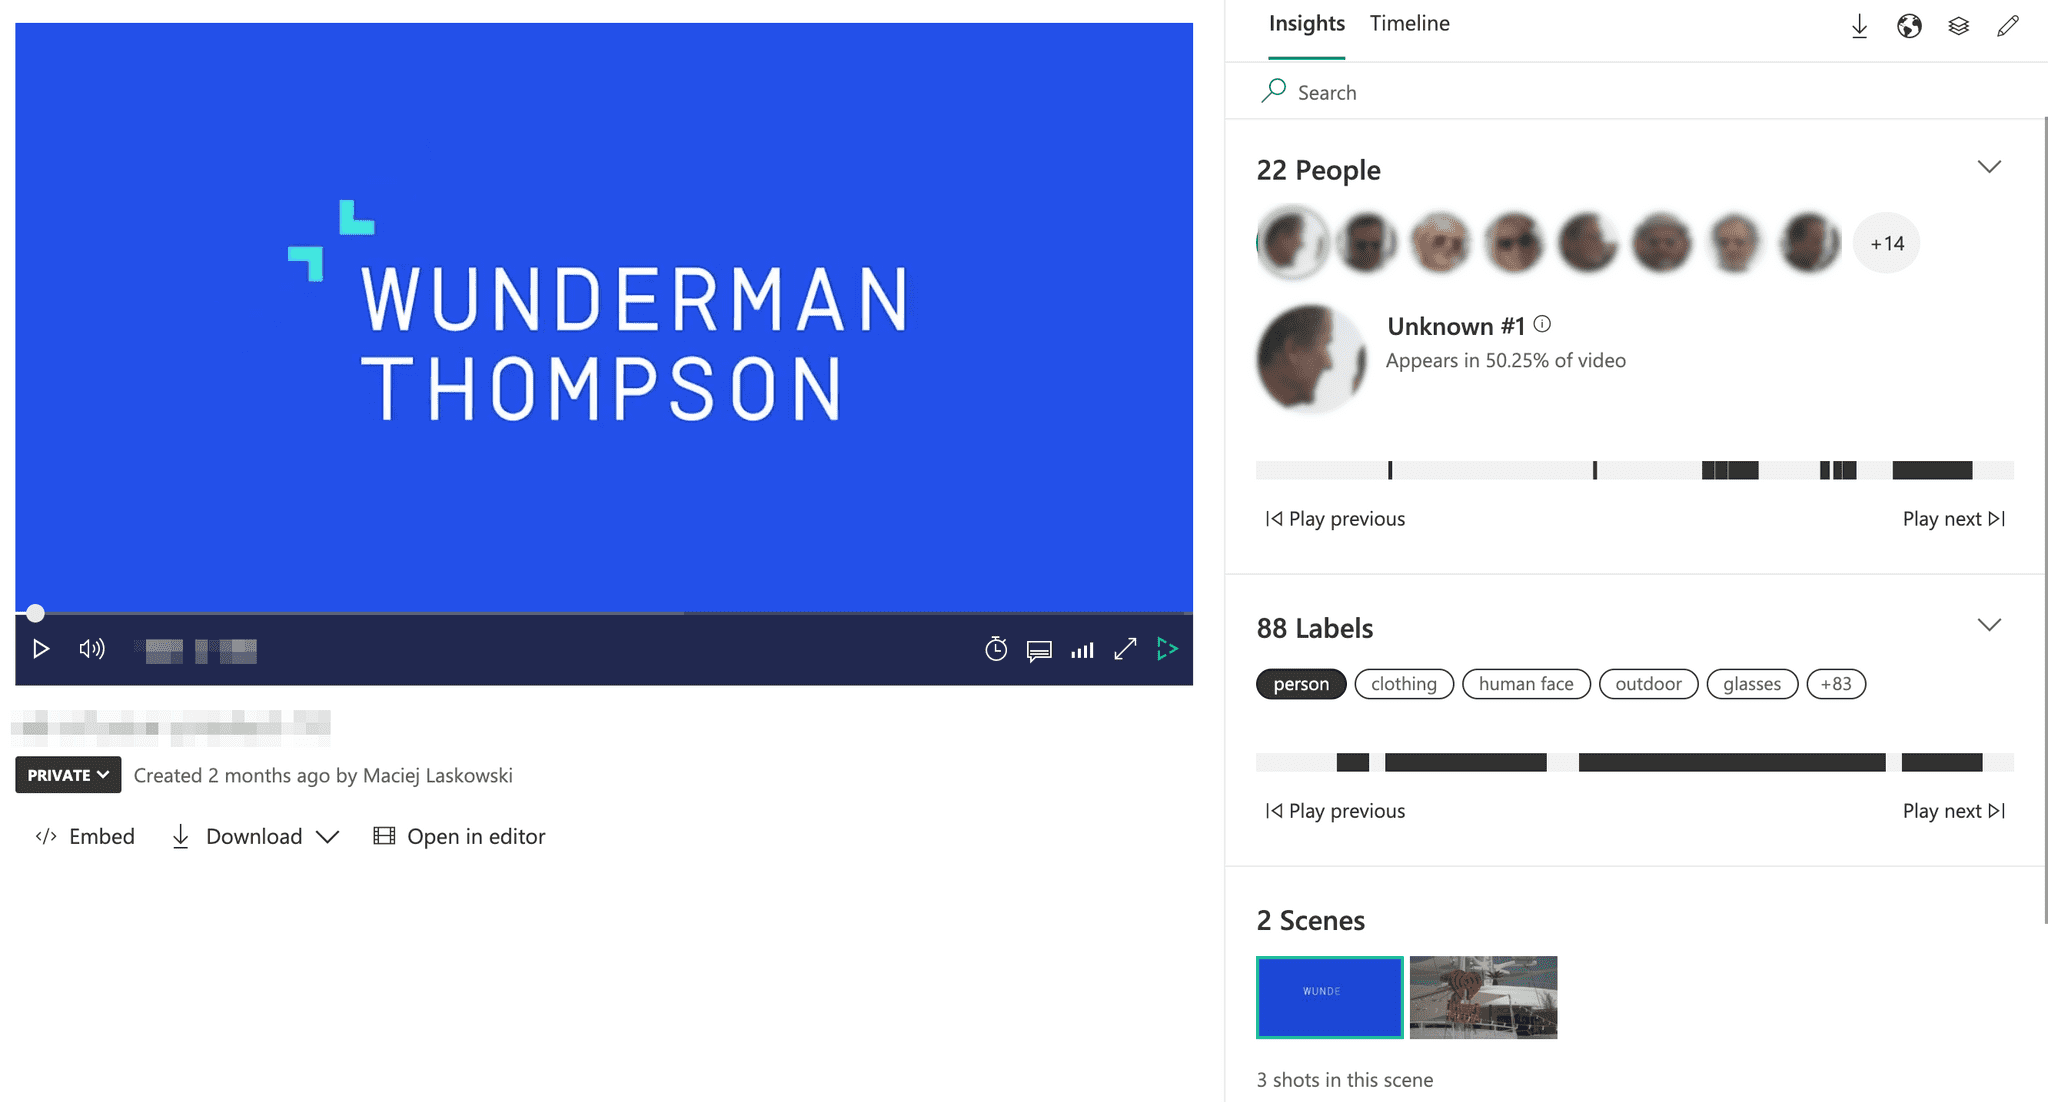
Video Indexer (VI) is a Microsoft Azure Cognitive service for extracting advanced metadata from video content. There are a couple of areas that VI can recognize, such as People (including celebrities recognition), Topics, Labels, Brands, and more. It can divide the video into scenes and shots as well, in a way a human would divide it.
This is how the data is presented by the VI GUI:
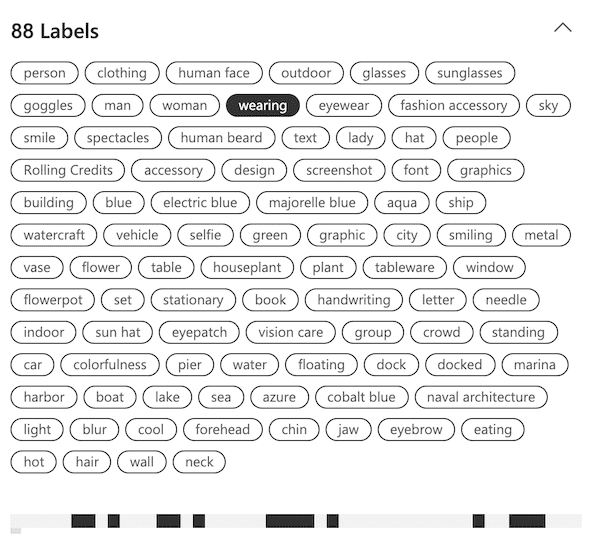
Let's focus now on the Labels feature which simply tags everything VI can recognize in the video (we will use label and tag names interchangeably throughout the post).
In this particular video, there were 88 different labels found. At the bottom of this section, you can see the video timeline with black areas that mark the parts of the video where each label was found. For example, the marked "wearing" tag was found eight times.
But there is more. VI exposes a REST API to upload videos that are later indexed (processed). When the processing finishes, we can get the results via the same API. And this is where the real fun begins.
Allen’s Algebra
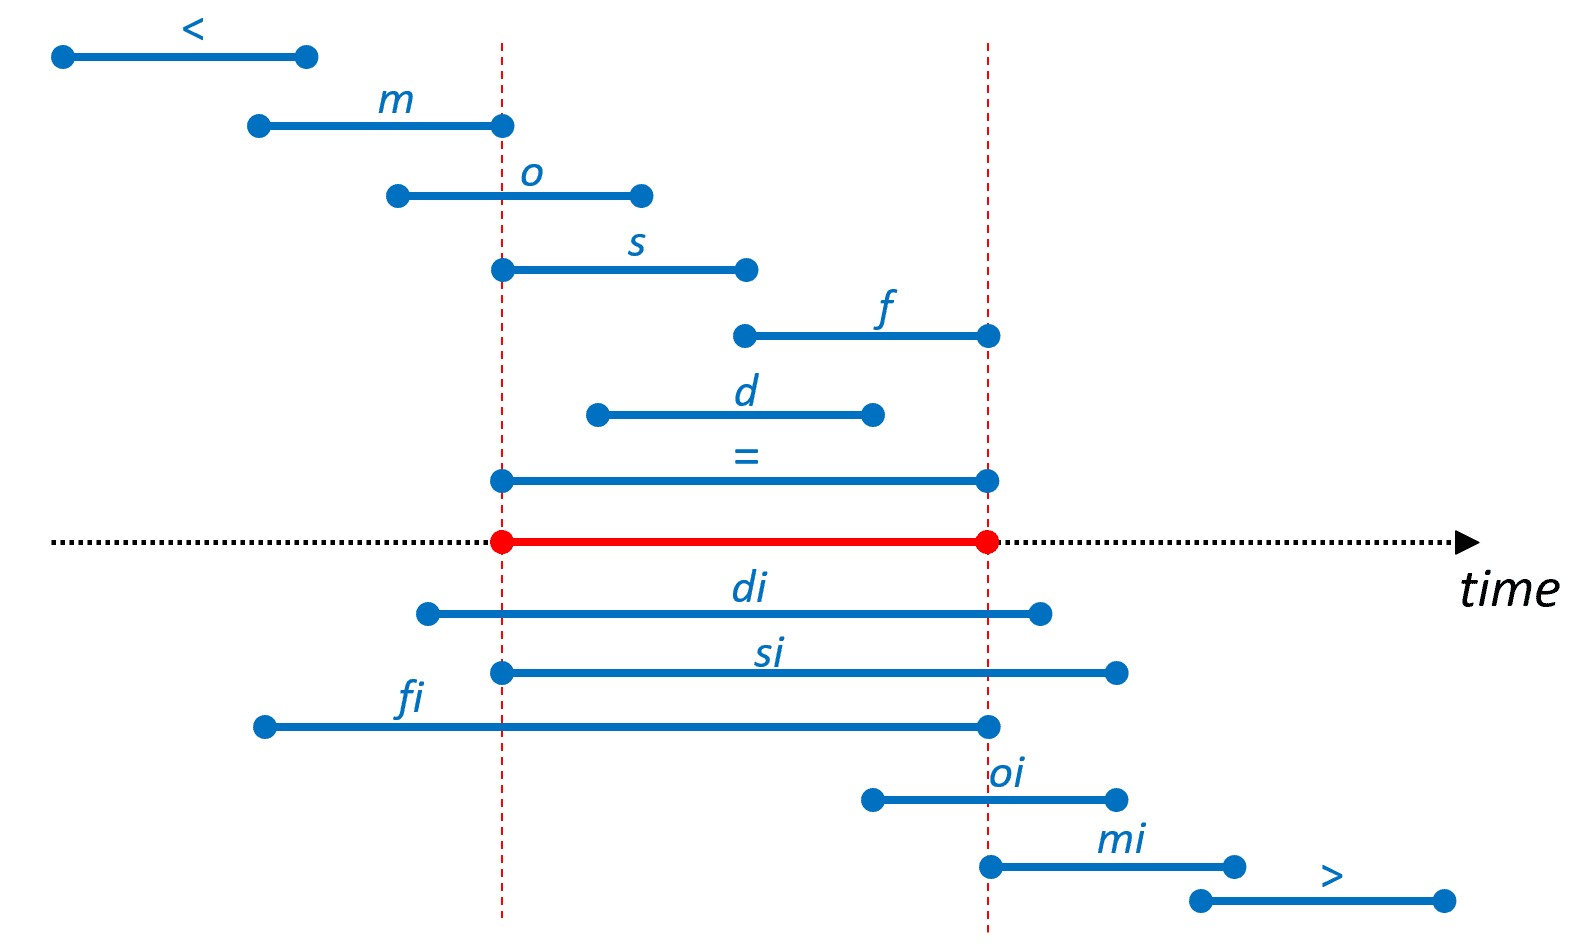
As you can see above, the MS Video Indexer assigns the tags to an approximate time span by providing a pair of time points (beginning and end) in milliseconds within the video. Just as we mentioned in the first section, defining our conceptual patterns is not that straightforward. Even if it were a simple combination of a few tags appearing simultaneously, it would rarely be exactly the same point in time - much more often, these tag frames overlap in various ways. Some relations are more qualitative than quantitative. That is why we decided to use Allen's algebra (James Allen, 1983) which is dedicated to supporting temporal reasoning and defines possible relations between time intervals (and calculation on them). So, any two time intervals X and Y could be in one of 13 Allen’s relations:
| Relation | Inverse |
|---|---|
| X < Y (X precedes Y) | X > Y (X is preceded by Y) |
| X m Y (X meets Y) | X mi Y (X is met by Y) |
| X o Y (X overlaps with Y) | X oi Y (X is overlapped by Y) |
| X s Y (X starts Y) | X si Y (X is started by Y) |
| X d Y (X during Y) | X di Y (X contains Y) |
| X f Y (X finishes Y) | X fi Y (X is finished by Y) |
| X = Y (X is equal to Y) | N/A |
Where i in the above notation stands for inverse. So that, for example, X m Y implies Y mi X. Check the
illustration below to see the visualisation of the relations between time intervals (red line is a reference point -
when the blue line has the name of a relation above it, it means Blue <relation> Red).
Experiment and VI outputs review
Let's go back to the problem we would like to solve. Our task was to identify an advert video ending automatically. Earlier, we mentioned that VI can divide the video into scenes and shots. However, after indexing over a dozen of videos we noticed that endings are not always the last shots in the last scene. So, a simple approach based on the timing of an ending sequence was not enough. We needed more context to detect a video ending.
This led us to create a toolkit that helped to understand the taxonomy of VI better, find related tags, and finally build the "video ending" conceptual pattern.
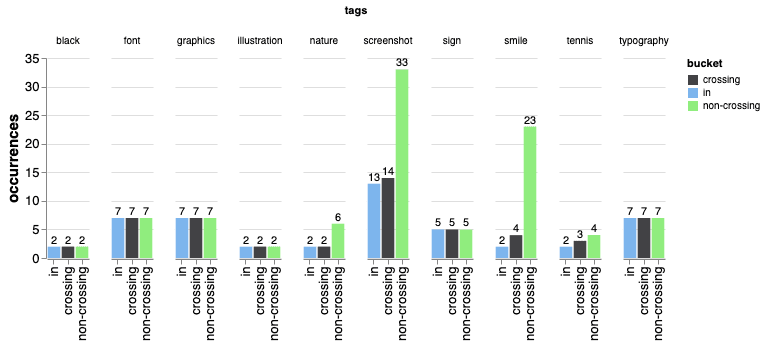
Having found a small set of tags (we will call it baseline tags) that occur during the video ending sequence, we can continue exploring other tags with another tool.
The core concept was to apply the aforementioned Allen's algebra in practice. We defined X as the period in the video
when a particular label is recognised by VI and Y as the part of a video in which any of the baseline tags appear. To
analyse the outputs, we grouped Allen's algebra relations into 3 buckets:
- “in” - the tag is contained within any baseline tag (includes:
d,di, and=), - “crossing” - an interval of the current tag and any baseline tag have a common interval (
o,s,f,d,=,di,si,fi, andoi), - “non-crossing” - the current tag occurred in an interval where no baseline tag was present.
After indexing dozens of videos we were able to find a common set of tags, that occur frequently in all those buckets mentioned above.
At this point we were able to automate finding similar tags and classify each tag into one or more buckets.
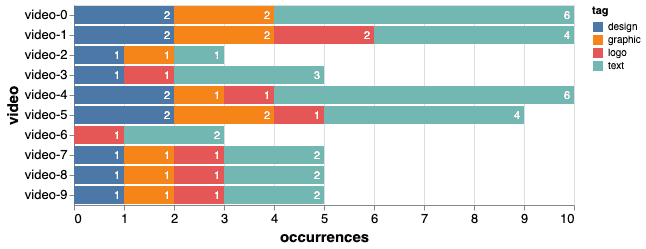
Conceptual patterns intensity chart
The above analysis shows that, for a conceptual pattern defined as an ending in a commercial advert video, we can find
tags appearing in various Allen’s relations with the ending itself (d, o, etc.). Also, some tags appear more often
and so could be treated as a more precise identifiers of the pattern, while other tags occur occasionally. Similarly,
some are more significant as they do not appear anywhere else, except in close relation with the pattern. Finally, some
tags are in a kind of negative correlation with the conceptual pattern – they could be found almost everywhere but not
in the pattern interval itself, which makes them a valuable criterion as well. To address that multiplicity of
dependencies, we decided to associate weights (positive or negative values) with some of the tags and to present the
overall output of the video scan in the form of an intensity chart for better readability of the results. Here is how it
works:
The plot you can see above displays the sum of weights assigned to the labels in time.
For detecting the ending sequence of this particular video, we used:
- 6 labels with positive weights (design, graphic, logo, text, screenshot, and font)
- 4 labels with negative weights (outdoor, person, human face, wearing)
Positive weights say more or less that we expect the label's occurrence during the ending sequence, while negative weights mean we don’t expect this label to occur in the ending sequence and its occurrence lowers the probability that the sequence we seek is present at a particular time.
Any point on the diagram is the sum of weights of all labels that occurred in the video at this particular moment.
Now, if we draw a line at the value of 1 (see the red line above), we can treat everything below the line as a non-ending sequence, and everything above as an ending sequence (conceptual pattern occurrence).
You can see a peak at the end of the video, starting near the 25th second - which is where the ending sequence starts on this video.
Summary
What we did was to propose a methodology (as well as the implementation that supports it) to extend standard Video Indexer analysis focused on identifying predefined tags describing some of the fundamental physical objects. This extension provides a deeper view, allowing us to find in each video some more abstract concepts and ideas, which are more intuitive but less easy to limit with simply yes-or-no definitions. Such methods could be especially valuable to marketing teams or people responsible for guarding policies and those ensuring that content is appropriate and bias-free.
The described implementation might be further extended. There are at least a few ideas we're considering. One of them is to extend the weight mechanism, so it could be replaced with fuzzy logic. In that case, the intensity chart would be a fuzzy set where time-points (smallest time slots analyzed, e.g. 0.1 sec.) constitute the universe of discourse and the sum of weights per each such time-point become the membership function of the fuzzy set. Applying fuzzy logic would allow calculations on conceptual patterns to be performed, leading to the application of some automated video assessment (fuzzy control).
That means expect more to come!
Hero image by Free-Photos from Pixabay, opens in a new window
