In this latest article in our ‘how to’ series for developers, you’ll learn how to get up and running with javascript debugging in IntelliJ, step through code, change variables, inspect objects and update CSS, HTML on the fly from within your IDE.
Debugging js in the browser has come on so much in the past few years. The developer console has literally changed lives -- By “literally” I don’t mean literally obviously, the developer console hasn’t prevented deforestation in South America or reduced the amout of plastic dumped into the environment, but in it's small way has made the working day a little bit better for web developers and that’s something I guess.
The ability to add breakpoints, watch variables, inspect objects, and step through methods is just amazing. Back in the day, your only option was to put alerts into the code and redeploy. There are times though when it’s handy to do those things in your IDE (Integrated Development Environment) so you can work directly on the actual source files during run time. This can be really helpful when debugging different scenarios and hunting down those elusive random failures which seem to lurk in the shadows waiting until it’s Friday afternoon or you have just hit the 'Deploy to prod' button!
Using your IDE to set breakpoints and step through the code is pretty much the same as using the developer console. It’s worth the effort to set it up, for example during runtime while you are stepping through the code you can edit the js by adding try catch blocks or extra if else statements. While working directly on the source files means you are less likely to lose track of what you have changed compared with browser overrides. You can debug remote servers in your IDE without any special setup on the server (unless you want to step through the backend code as well). To debug UI assets on a remote server all you need is to have access to AEM Publisher or Author (not the Dispatcher as you will need to add the ‘debugClientLibs’ query string parameter to expand the relevant client lib).
Prerequisites
To get js debugging working with IntelliJ Ultimate is pretty simple these days. You just need to make sure you have JavaScript Debugger plugin, which should be installed by default, the LiveEdit plugin installed in your IDE and the browser extension installed in Chrome/FireFox. I don't think the JavaScript Debugger pulgin is available in IntelliJ Community Edition at the time of writing.
Open a project in IntelliJ
To open a project in IntelliJ, the UI asset paths don’t need to match that of the target deployment. For example, on my
website the js files are served from /etc/designs/zg/showcase/desktop/js/*, but my IntelliJ project only contains the
‘desktop’ folder and the js path is desktop/js. The debugger will map the js paths from the website to my local file
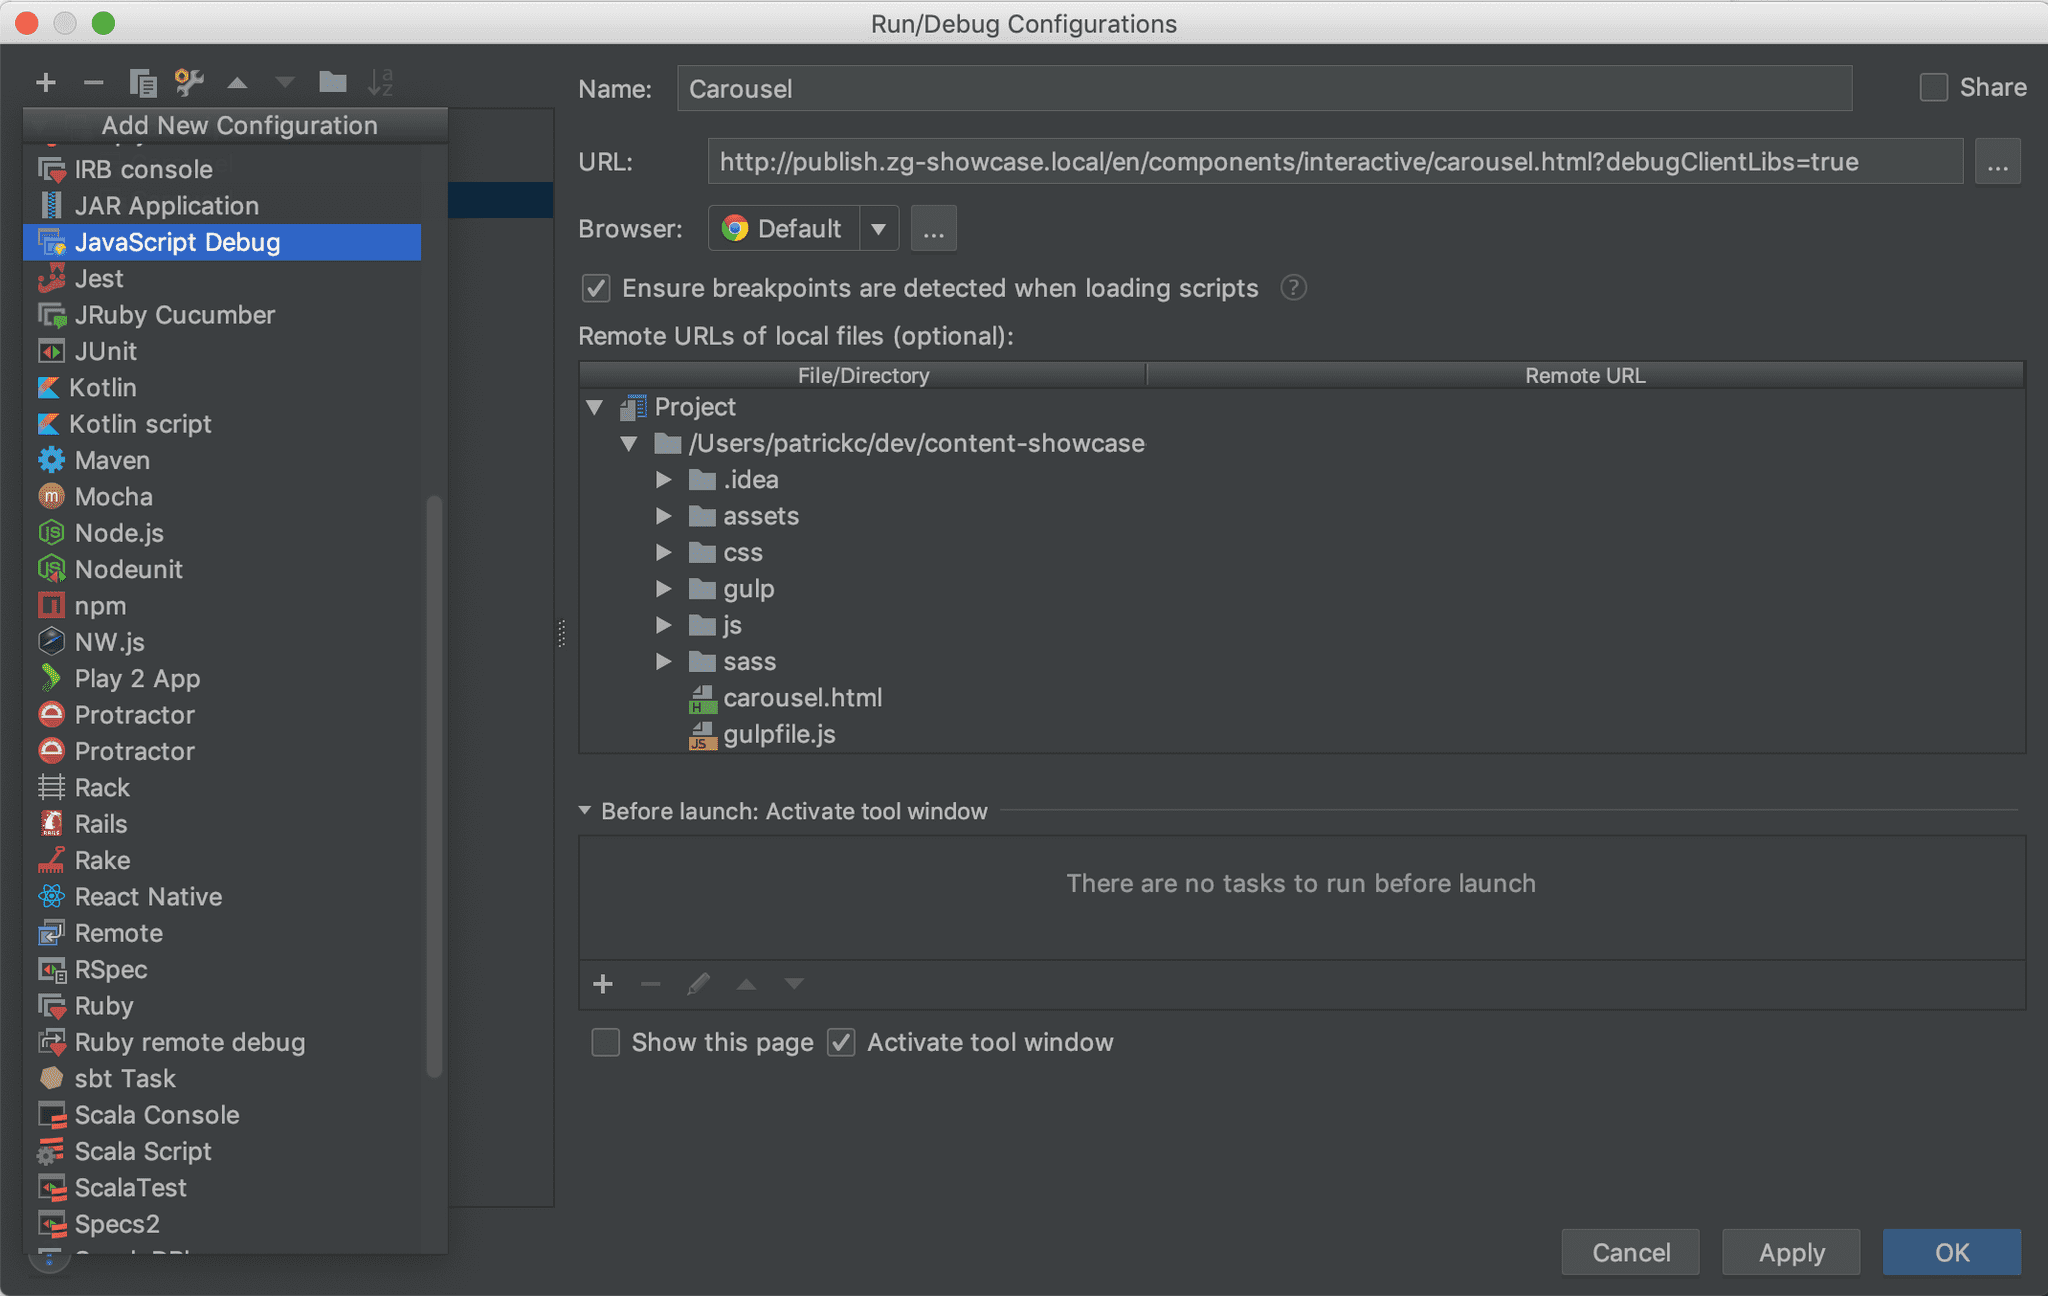
versions automatically. Create a debugging configuration Firstly you need to get the URL of the page you want to debug
including the ‘debugClientLibs’ querystring param. As an example, I’m running the ZG showcase site in publish mode in a
local vm and looking at the Carousel component demo page, so the URL in this instance is
http://publish.zg-showcase.local/en/components/interactive/carousel.html?debugClientLibs=true. The critical thing here
is not the domain, port, path, or page name, but the fact that the ClientLibs are in debug mode.
 For more info see
Run/Debug Configuration: JavaScript Debug
Run debugger
Once you have a debug configuration set up you just need to click the bug icon to launch the debugger and add a breakpoint or two to the js in the source editor.
Debugger overview
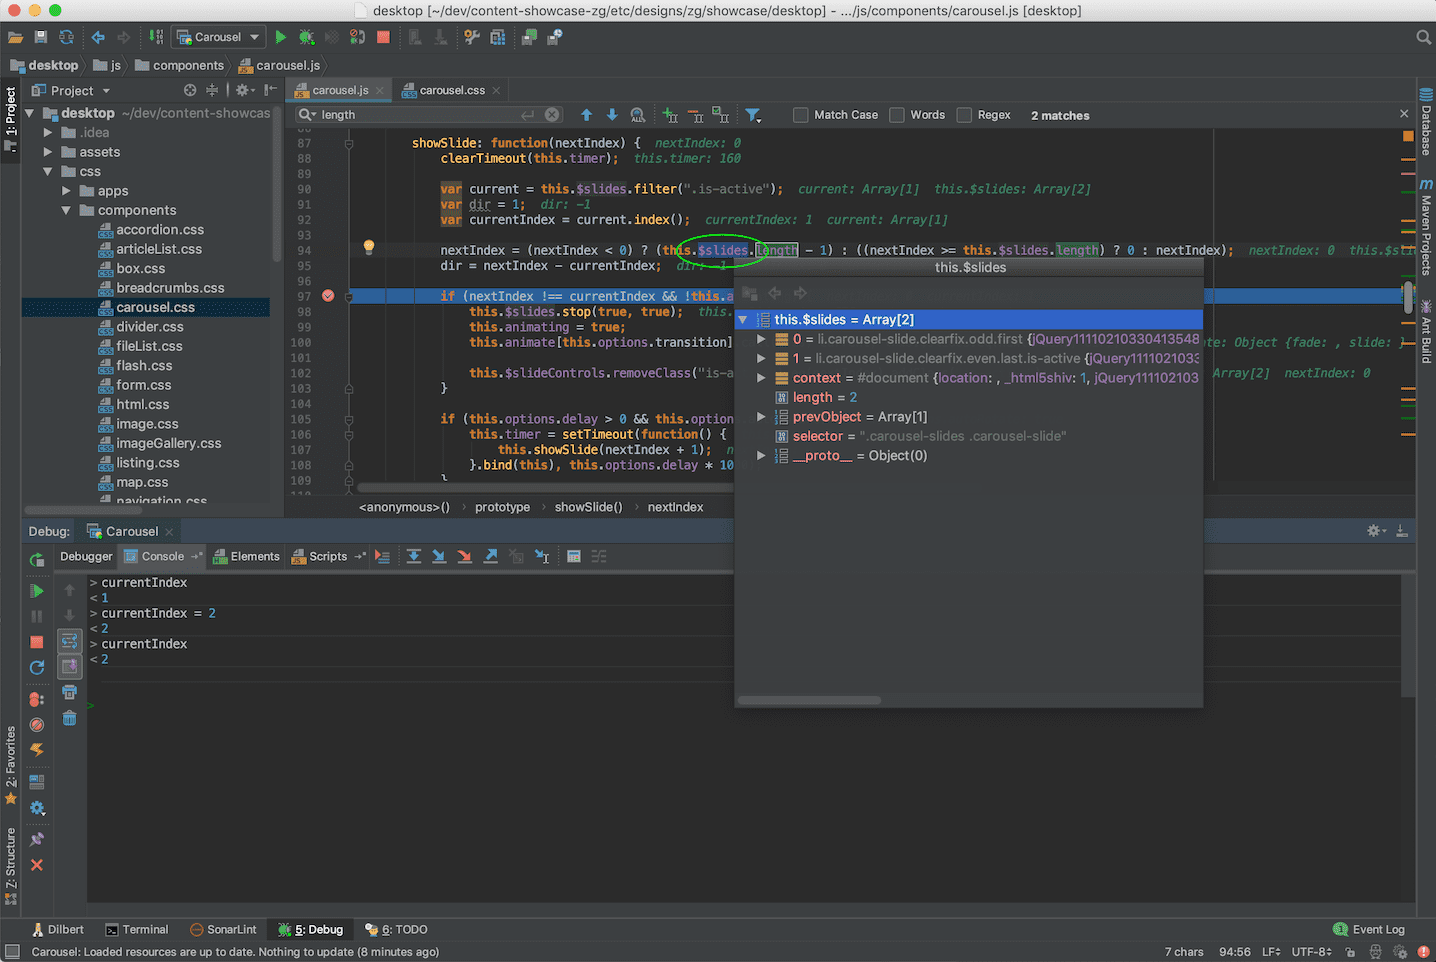
Fire it up and you’ll then be able to see and amend the current variable values, inspect objects, step through and edit the code.
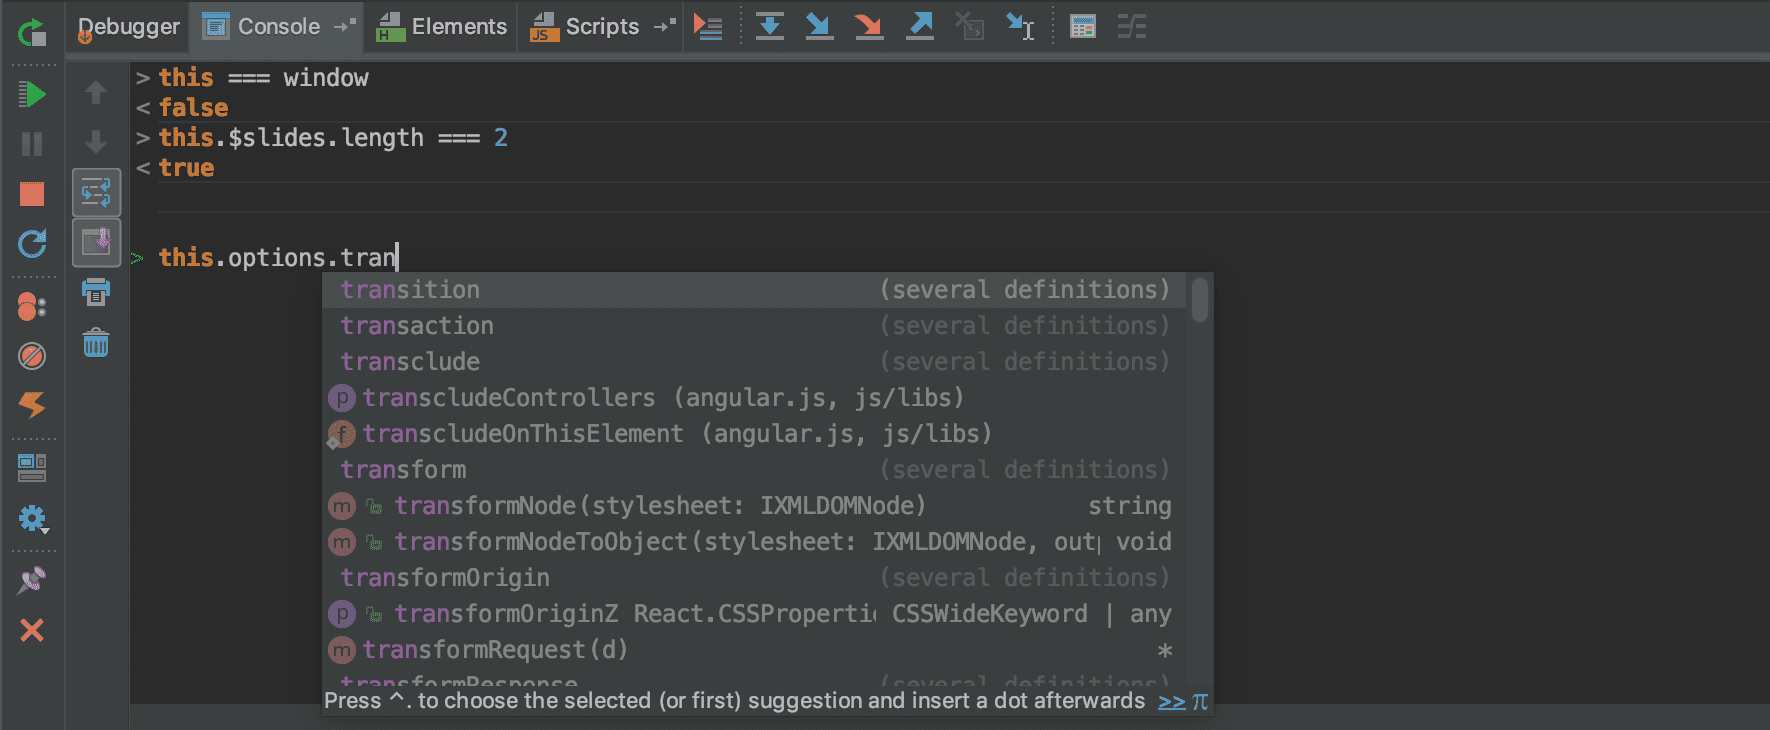
The debugger interface is self explanatory, the console is in the current context, you can reassign values to local variables, click on an object in the main js window to open the popup inspector.
In the console code completion works for local variables.
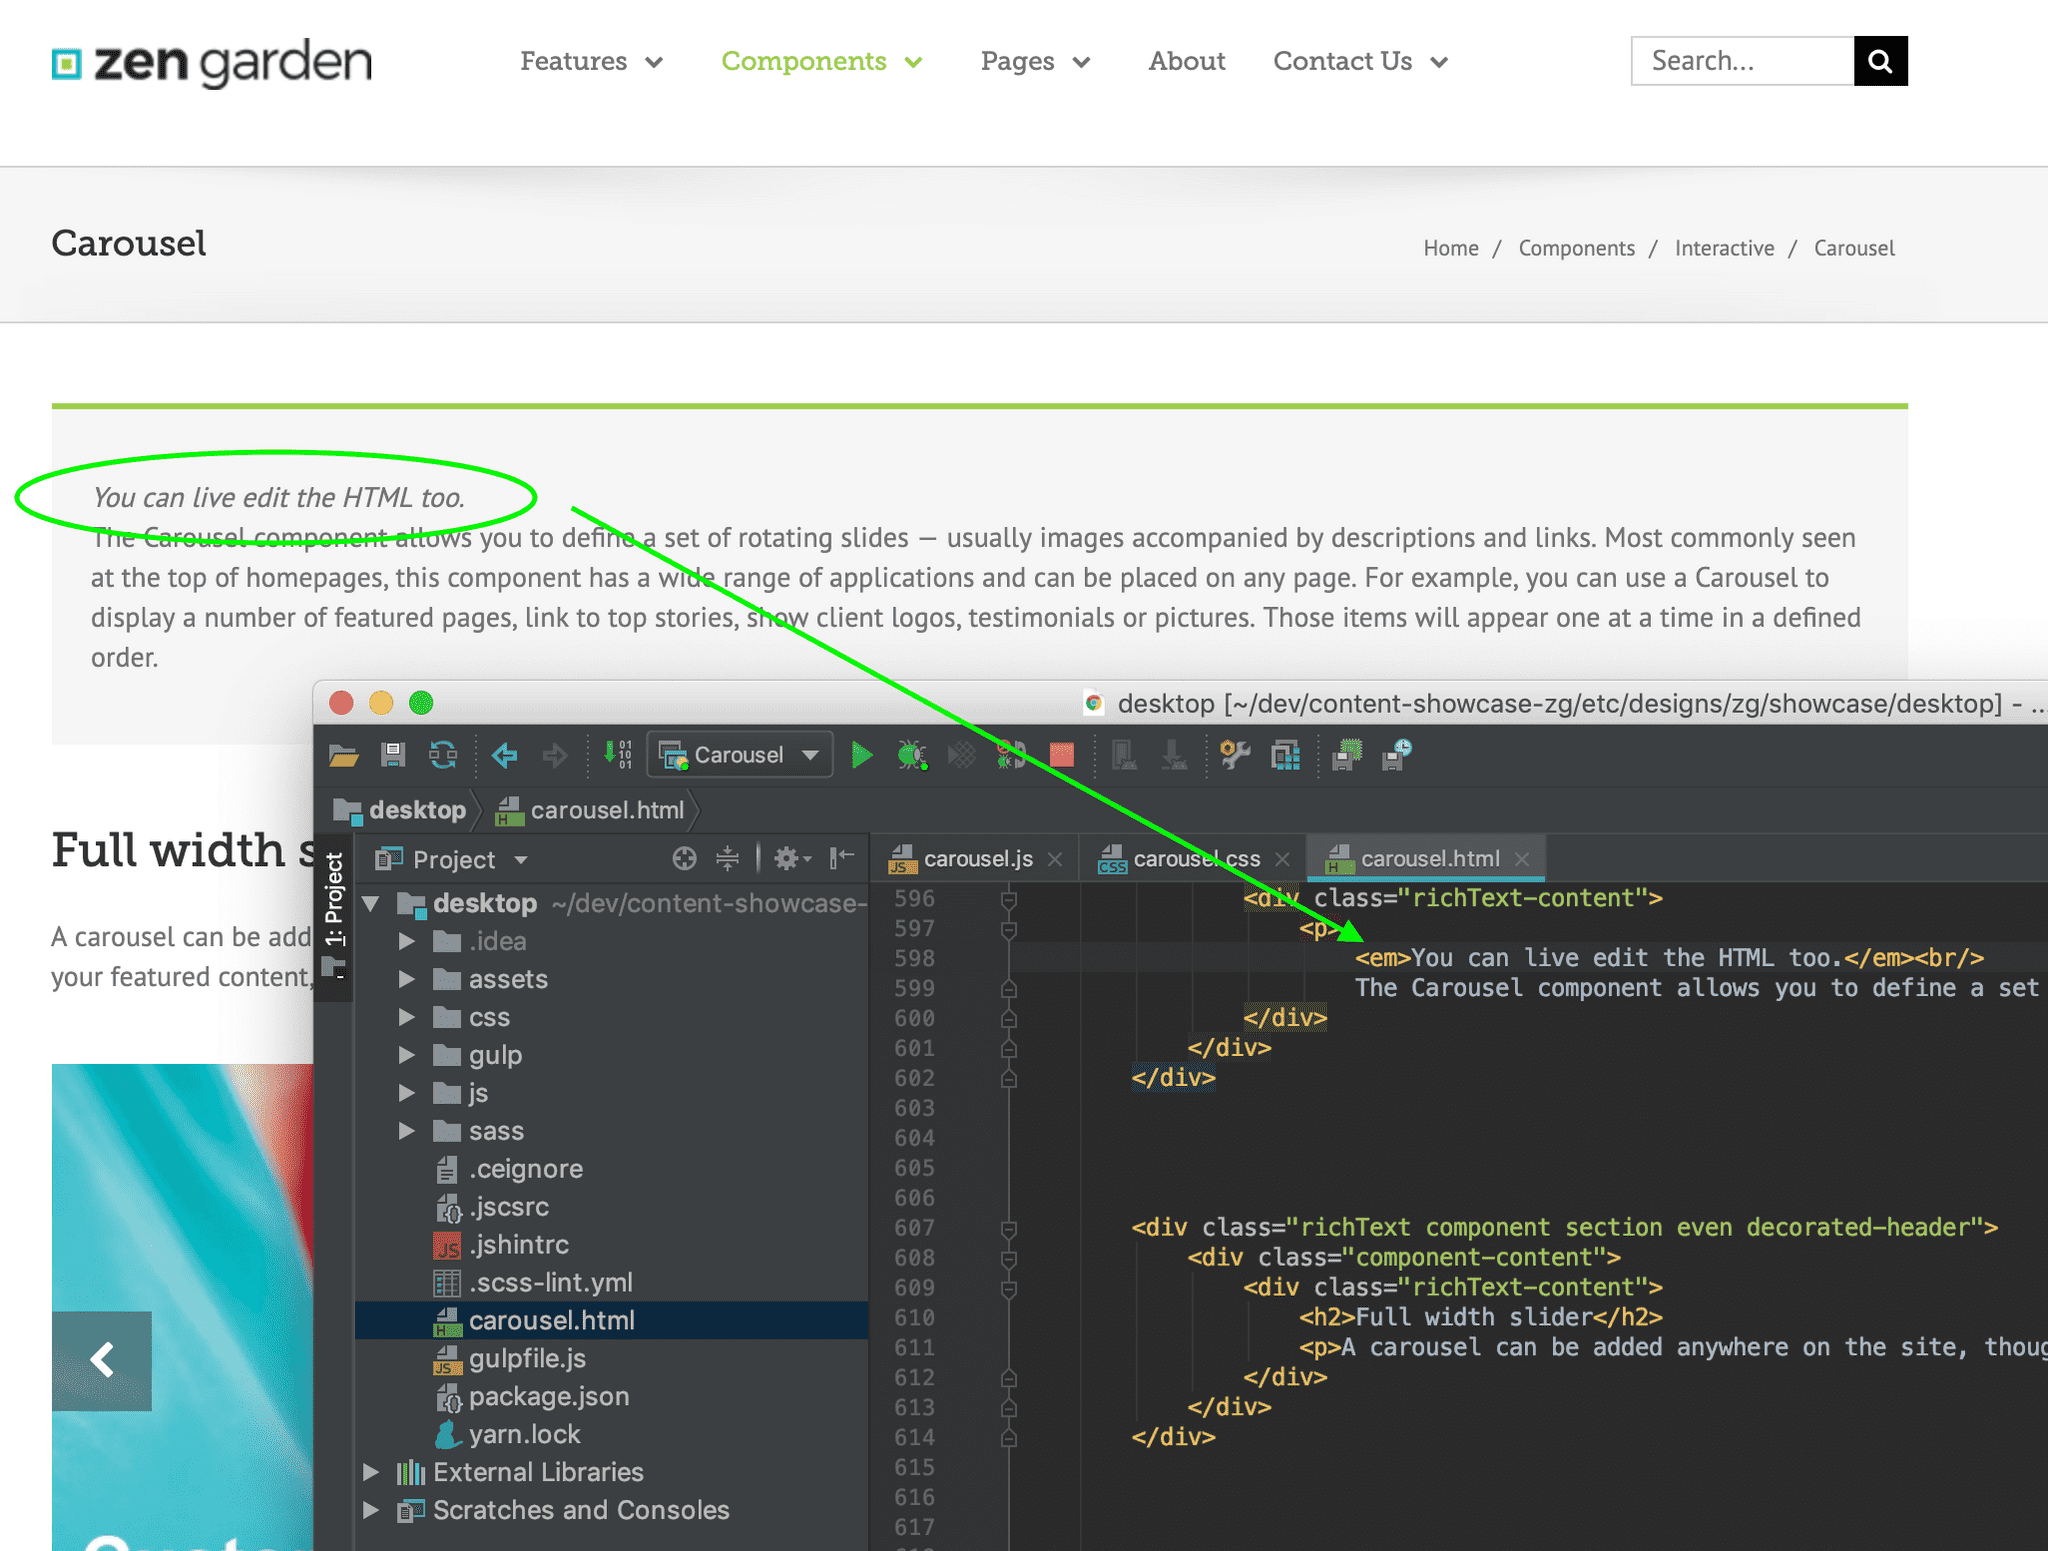
If you think it might be handy to edit the HTML as well, you can copy the source of the page you are debugging and create a file locally with the same name. This will be used by the IDE as the base file for hot swapping. The CSS is also supported by LiveEdit.
I'm sure you can do all this with pretty much any decent IDE. It seems like the cool kids change their IDEs on a monthly basis, I'm a bit old school though and been using IntelliJ for some time, truth be told, I'd probably still be using HomeSite5 if I had my way. Sadly I don't have a floppy drive on my computer so can't install it. Ah well, you can't have everything!
Useful links
Hero image source


